Is your store leaking revenue?
Find out exactly where you're losing sales — takes 2 minutes.
Two labels per product, one afternoon of data, and a catalog that finally has a progression
What Is Product Portfolio Analysis for an Ecommerce Store?
Your bestseller might be costing you money.
Product portfolio analysis is a review that sorts every product a business sells by the job it does, so money and attention go where they compound. BCG founder Bruce Henderson popularised the idea in 1970 with the growth share matrix (Wikipedia). BCG's own history page says about half of all Fortune 500 companies once used it.
The BCG version sorts whole business units by market share and market growth. That works for a conglomerate deciding which division to fund. It does not work for a Shopify store with 140 SKUs.
Your products share one market, one checkout and one ad account. What separates them is what each product does to the customer who buys it. So for a store, product portfolio analysis asks a sharper question. When someone buys this SKU, what happens next?
The version built for stores is the SKU role map. It comes from the Hard Margins podcast by RetentionX, and it gives every product two labels on two separate axes:
- An economic role. Does the product bring customers in, drive a second purchase, protect margin, or erode it?
- A behavioural role. Do buyers rebuy this item, and do they stay with your store?
Most teams do something else. They sort the Shopify sales report by revenue and call the top line the hero. That one sort hides both labels. Here's why.
Why Does Ranking SKUs by Revenue Mislead You?
Revenue tells you what sold. Not what it did.
Revenue rank misleads because two products can post the same sales total while recruiting very different customers. That difference compounds: Bain research by Frederick Reichheld shows a 5% rise in customer retention lifts profits by 25% to 95% (Harvard Business Review, 2014). A cohort view shows which SKU drives retention.
Shopify already gives you that cohort view. Its Customer cohort analysis report, described in the Shopify Help Center, groups customers by the month of their first order and tracks their repeat orders after that.
Picture two SKUs at the top of your sales report. Same revenue. Same rank.
The first brings in buyers who come back for a refill, then try a second category. The second brings in bargain hunters who buy once during a sale, return a share of orders, and never open your emails again.
In a revenue dashboard, those two products look identical. In a cohort view, they look nothing alike. The Hard Margins host puts it plainly: the gap between the two views is where portfolio misalignment hides.
Ask how your own "hero" got there. Was it the product that got the best placement, the most ad spend and the most reviews for years? Then it may rank first because it was promoted first, and nobody has checked whether its buyers came back.
That is the difference between a true hero and a false hero. A true ritual hero earns its position through cohort behaviour: low returns, fast payback, high repeat rate. A false hero is just the most visible product in the catalog.
It also explains a frustrating loop. The podcast's worked example is a brand doing USD 100 million a year that launched six new products over 12 to 18 months to find the next hero. None broke through. The incumbent had the best placement, spend and social proof. Each new product got one email and a few scattered ads. That is a distribution problem mistaken for product feedback.
What Are the Four Economic Roles of a SKU?
Every product has a job. Most catalogs never name it.
The four economic roles are acquisition SKU, retention driver, margin protector and profit trap. The Hard Margins podcast defines them by one question: does this product bring customers in, drive a second purchase, protect margin, or erode it? Classify every SKU in 1 of these 4 roles before you look at stickiness.
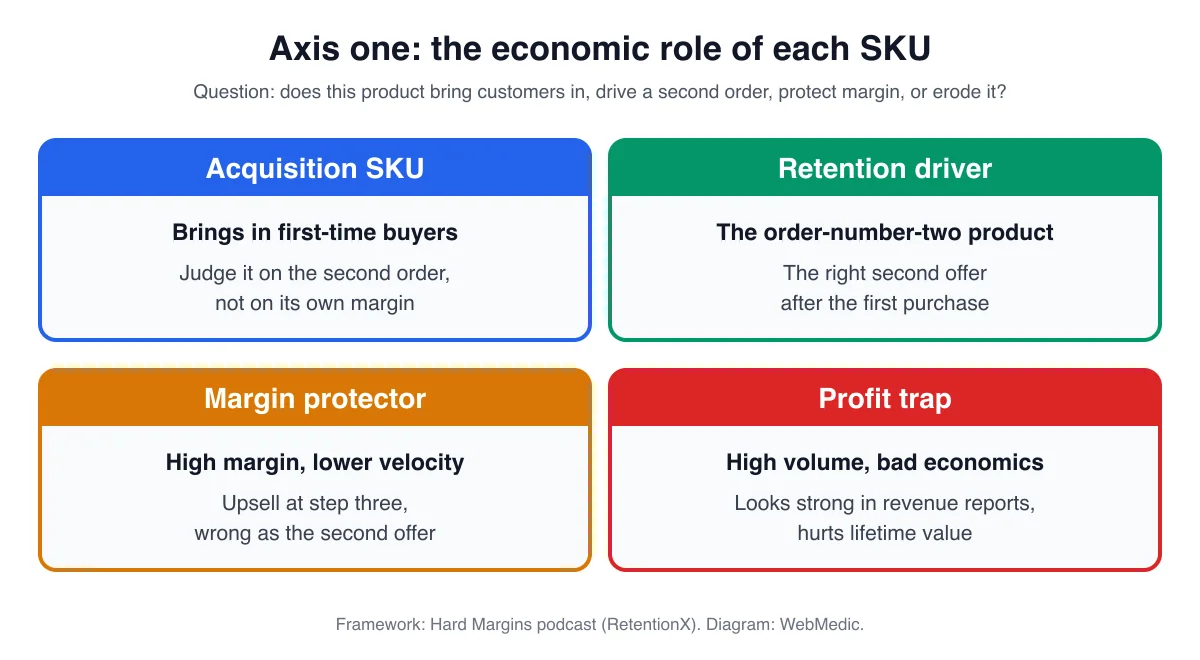
| Economic role | What it is | How to treat it |
|---|---|---|
| Acquisition SKU | Brings first-time customers in. May not have strong economics on its own, but creates the conditions for a second order | Judge it on what happens after, not on its own contribution margin |
| Retention driver | The order-number-two product. Buyers of the acquisition SKU naturally buy this next and start repeating | This is your correct second offer |
| Margin protector | High contribution margin, lower velocity | A good upsell at step three. The wrong second offer for a first-time buyer |
| Profit trap | High volume, bad economics. Looks strong in revenue reports and hurts lifetime value | Find it before it sets your growth plan |
Source: role definitions from the Hard Margins podcast (RetentionX). Treatment column summarised by WebMedic.
The roles connect. When an acquisition SKU naturally leads into a retention driver, you have a compounding loop. Push a margin protector or a profit trap as the second offer and you either leave money on the table or train the wrong buying habit.
A note on names
You will hear four names for the product customers enter through: hero product, entry product, front door and acquisition SKU. They point at the same thing with one difference.
Acquisition SKU is a class. A catalog can hold several. The hero is the single dominant one. Every hero is an acquisition SKU. Not every acquisition SKU is the hero.
And "hero" is not "ritual hero." Hero describes the product that does acquire most customers today. Ritual hero is a verdict about behaviour, which we cover next.
Where weighted contribution margin fits
People mix this up with margin math. Weighted contribution margin is an accounting formula that blends margins across your sales mix to find break-even. It tells you what the mix earns. It does not tell you what each product is for.
You need the margin number as an input. The role is the decision you make with it.
What Are the Four Behavioural Quadrants?
The second axis asks about loyalty. To what?
The behavioural axis plots each SKU on product stickiness (do buyers rebuy this item?) against brand stickiness (do they stay with your store?). That creates 4 quadrants: ritual hero, brand anchor, solo item and long tail. The Hard Margins podcast says each one needs a different cross-sell strategy.
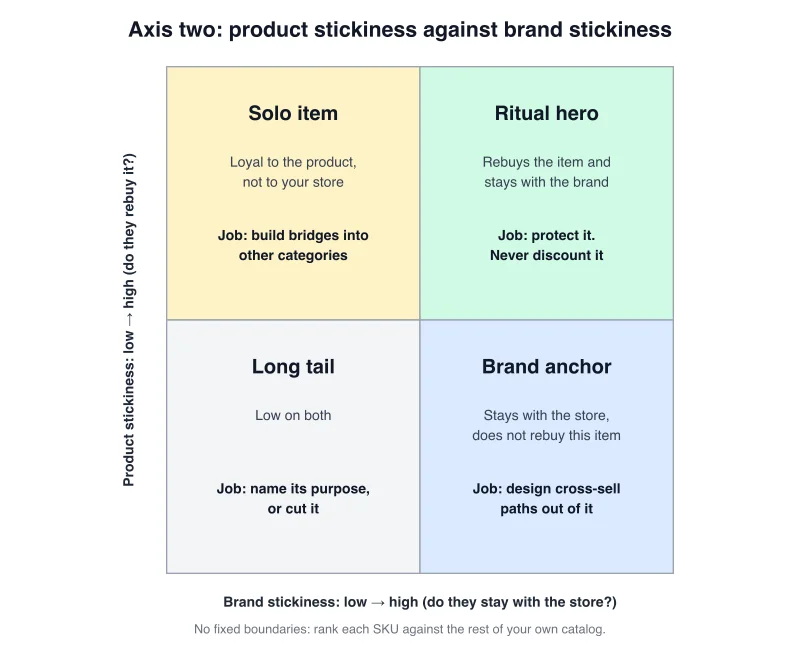
| High brand stickiness | Low brand stickiness | |
|---|---|---|
| High product stickiness | Ritual hero. The compounding lifetime-value engine. Do not discount it into a commodity | Solo item. Loyal to the product, not to you. Build bridges into other categories before they leave |
| Low product stickiness | Brand anchor. Buyers stay and explore other categories. Design cross-sell paths out of it. Often a strong acquisition product | Long tail. Ask whether it serves a purpose you can name, or just dilutes the catalog |
Source: quadrant names and jobs from the Hard Margins podcast (RetentionX).
Two warnings before you start plotting.
There are no numeric boundaries. The source gives no threshold for "high" repeat rate and no cut-off for "sticky." Anyone who quotes you one invented it. Rank each SKU against the rest of your own catalog instead. Top third, middle, bottom third. Your catalog median is the line.
Long tail is not the same as profit trap. A profit trap is high volume with bad economics. It can be your number one seller. A long-tail SKU is low on both stickiness measures and usually low on volume too. Mixing them up leads you to cut harmless products and keep the one that is actually hurting you.
How Do the Two Axes Work Together?
Economic role first. Behaviour second. Always.
The two axes describe the same catalog from two directions, and every SKU gets one label from each. The Hard Margins audit sequence maps economic roles first, then layers in stickiness. One SKU can be both an acquisition SKU and a ritual hero, which is the best front door a store can have.
The economic tag says what the product does to your profit. The behavioural tag says what it does to the customer relationship. Some combinations you will see:
- Acquisition SKU + brand anchor. Customers enter, then explore. Your job is the cross-sell path. This is the combination the podcast host maps directly: brand anchors are generally strong acquisition products.
- Acquisition SKU + ritual hero. The dream. Buyers rebuy it and stay. Protect its price and its placement.
- Acquisition SKU + solo item. Buyers reorder the same thing and never go deeper. Revenue looks stable. Lifetime value stays flat.
- Profit trap + anything. Fix the economics or stop feeding it paid traffic.
Do not try to read an economic role off a quadrant. A ritual hero can sit on your entry product or on your retention driver. Keep both labels on the SKU that earns both.
Not sure which of your products is doing the heavy lifting? Find out where you're leaking revenue. Take the free Revenue Score. 3 minutes. Free. No pitch.
How Do You Build a SKU Role Map From Your Store Data?
You need two numbers per product. Then a third.
Pull 2 numbers per SKU for the last 30 to 90 days: repeat lift, meaning the change in second-order rate among its buyers, and net contribution margin percentage. Plot them, then add units sold as a third column. This method comes from the Hard Margins podcast, and Shopify's cohort report covers the repeat read.
Block out an afternoon.
Step 1: Pull repeat lift per SKU
Repeat lift is the change in second-order rate among customers whose first order included this SKU, compared with your store average.
In Shopify, start with the Customer cohort analysis report under Analytics. To split cohorts by first product you will usually need an order export or a tool such as Lifetimely or Triple Whale. The method matters more than the tool.
Step 2: Pull net contribution margin percentage per SKU
Net means after cost of goods, shipping, payment fees, discounts and returns. Our contribution margin formula guide walks through every line. Watch returns: a strong gross margin with a high return rate can land in profit-trap territory once refunds come out.
Step 3: Add velocity
A margin protector and a profit trap differ mainly on volume. So carry units sold in the same window as a third column. On a chart, use dot size.
Step 4: Plot and label
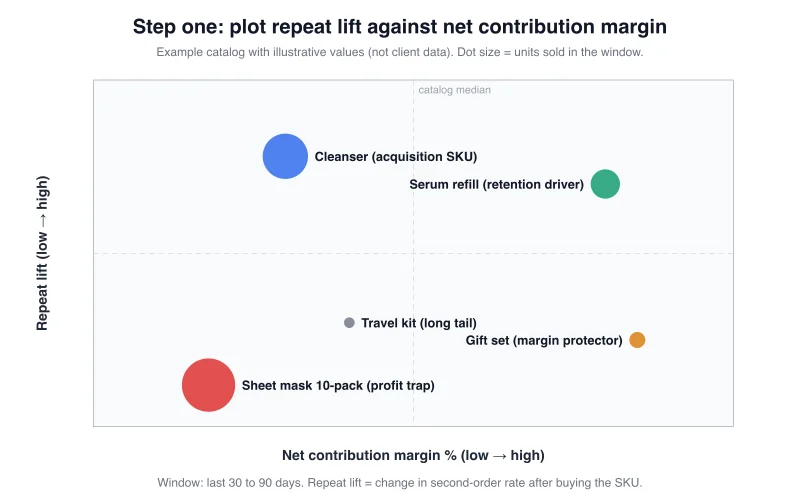
Here is a worked example with illustrative numbers, not client data. Imagine a skincare store with five products:
| Product | Repeat lift vs store average | Net CM % | Units (90 days) | Economic role |
|---|---|---|---|---|
| Cleanser | High | Low | High | Acquisition SKU |
| Serum refill | High | High | Medium | Retention driver |
| Gift set | Low | High | Low | Margin protector |
| Sheet mask 10-pack | Low | Low | Highest | Profit trap |
| Travel kit | Low | Below median | Very low | Long tail candidate |
Illustrative WebMedic example. Rank values against your own catalog median.
Look at the sheet mask pack. It is the top seller by units. In a revenue report it looks like the hero. On this chart it sits bottom left with the biggest dot. The podcast host says most brands are surprised by what turns out to be a profit trap when they look at it this way.
Step 5: Layer in stickiness
Now give each SKU its behavioural label. Product stickiness is the share of buyers who rebuy that exact item. Brand stickiness is the share who place any second order. Rank both against your catalog and place each SKU in a quadrant.
Then segment by acquisition product. For each first-purchase SKU, follow those customers for the next 12 months. Which entry products create buyers who expand into the wider catalog? Which attract people who buy once and leave? The podcast host is direct about the answer: it should decide where your paid media goes.
What Should Change Once Every SKU Has a Role?
A label nobody acts on is just a spreadsheet.
The Hard Margins podcast names 4 decisions the SKU role map should drive: paid media allocation, collection sorting, bundle construction and the overall merchandising hierarchy. On top of those, write 1 upgrade path from entry product to retention driver to margin protector, plus an explicit list of SKUs that never go on sale.
Paid media
Put acquisition spend behind the entry products whose cohorts expand. Pull it back from the SKUs that recruit one-time buyers, even when their return on ad spend looks fine on day one.
Collection sorting
Ritual heroes and retention drivers earn the top slots for returning visitors. Profit traps lose their automatic top spot. Our merchandising slot model shows how to turn these roles into sort rules.
Bundles
Bundle the acquisition SKU with its retention driver, so the second purchase happens inside the first. Do not bundle a profit trap to "move volume." You will move more of the wrong thing.
The upgrade path
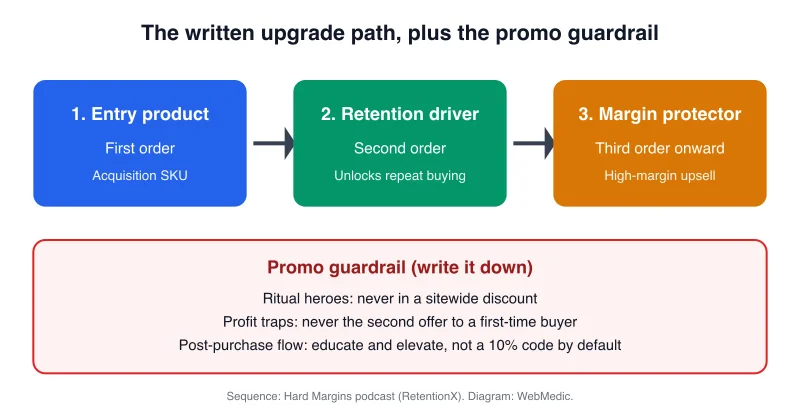
"Most brands have products, very few have a true progression." That line from the podcast is the whole point. Write the path down:
- Entry product. The first order.
- Retention driver. The second offer, in your post-purchase flow and on the thank-you page.
- Margin protector. The third order onward, for established customers.
Once you know which SKU deserves the second-order slot, your cross-selling setup has a clear brief. The role map decides what to recommend. The cross-sell tactics decide how.
The post-purchase flow should educate and lift the customer to the next step. Firing off a 10% discount on the next order by default does the opposite.
The promo guardrail
This is the step teams skip. Decide in writing which SKUs and which customers are eligible for promotions.
- Ritual heroes stay out of sitewide sales. Discounting them teaches your best buyers to wait.
- Profit traps never become the second offer.
- Long-tail SKUs with no named purpose are candidates to clear out, not to protect.
If you want the full eligibility policy, our discount strategy guide covers how to write one.
Does the Same SKU Play a Different Role on Shopee and Your Shopify Store?
Often, yes. And it matters in Southeast Asia.
A SKU's role belongs to a channel, not just to the product. Many Malaysian and Singaporean brands sell on Shopee, Lazada and Shopify at once, and each channel has its own buyers, fees and prices. Build 1 role map per channel, because a Shopee acquisition SKU can be a profit trap on Shopify.
Picture a regional skincare brand selling on both. A low-priced bundle is the front door on Shopee. It rides vouchers and campaign days, sells in volume, and pulls in new buyers. On the marketplace, it is an acquisition SKU.
On the Shopify store, the same bundle tells a different story. Customers who start with it rarely come back, because the store's repeat buyers prefer the full-size refill. There, it may be a profit trap.
Three rules for multi-channel catalogs:
- Map each channel on its own. Marketplace fees, voucher costs and shipping subsidies change net contribution margin per channel.
- Do not copy marketplace promos to your store. A SKU that needs vouchers on Shopee does not need the same discount on Shopify, and your ritual heroes should not follow it.
- Use the store for the upgrade path. Marketplaces own the customer relationship. Your own store, email list and post-purchase flow are where the retention driver and margin protector steps happen. If your inventory runs across both, our Shopify and Shopee integration guide covers the setup.
How Often Should You Redo Product Portfolio Analysis?
Roles drift. Check them on a schedule.
Rerun the SKU role map every quarter, using a fresh 30 to 90 day window from the Hard Margins audit method, and after any new launch has had a fair test. The Shopify Help Center says its cohort report can show cohorts by week, month or quarter, so drift shows up early.
Between reviews, watch for three signals:
- Return rates creeping up on entry SKUs. A front door attracting the wrong buyers shows it in returns first.
- More discounting just to hit the monthly number. A false hero is often carrying the plan.
- New launches judged on one email. If a product never got placement, spend and reviews, you tested your distribution, not the product.
Compounding brands, the podcast says, have mapped every SKU's job, built merchandising around it, and made it measurable week to week. That is the difference between a product list and a growth system.
Frequently Asked Questions
What is product portfolio analysis in ecommerce?
Product portfolio analysis in ecommerce sorts every SKU by the job it does for the business. The SKU role map gives each product 2 labels: an economic role (acquisition, retention, margin protector or profit trap) and a behavioural quadrant based on product and brand stickiness. Those labels then guide ad spend, bundles and promotions.
Is the SKU role map the same as the BCG matrix?
No. The BCG growth share matrix, popularised in 1970, sorts business units by market share and market growth. The SKU role map sorts products inside one store by what happens after someone buys them: repeat lift, net contribution margin and velocity. It suits a catalog where every product shares one market and one customer list.
What is the difference between a hero product and a ritual hero?
A hero product is the single SKU that currently acquires most customers. A ritual hero is a behavioural verdict: buyers rebuy it and stay with the brand. Your hero may or may not be a ritual hero. Check its 12-month cohort for low returns, fast payback and a high repeat rate before you protect it.
What numbers do I need to build a SKU role map?
You need 3 numbers per SKU from the last 30 to 90 days: repeat lift, which is the change in second-order rate among its buyers; net contribution margin percentage after costs, fees, discounts and returns; and units sold. Rank each one against your own catalog median, because the method sets no fixed thresholds.
Should I stop selling my profit trap products?
Not straight away. First fix what you can: price, pack size, shipping cost or return rate. Then stop pushing it as the second offer and cut its paid traffic. A profit trap can be a top-3 seller by revenue, so removing it overnight can hurt cash flow before your retention drivers take its place.
Keep Reading

Free Download
We audited 10 Shopify stores doing $1M–$20M. Here are the 15 leaks every one had.
Real screenshots (names blurred). Most operators have 8 of the 15 and don't know it.
From 10 audits across SG, MY, AE — fashion, beauty, electronics, food.
PDF in your inbox in 30 seconds. 1 email. No follow-up unless you ask.